Overview
InLong DataProxy mainly consists of connection convergence, routing, data compression, and protocol conversion. DataProxy acts as a bridge from the InLong Agent to the message queue, When the DataProxy pulls the metadata of the data streams from the Manager module, the corresponding relationship between the data streams and the topic name of the message queue is determined. When DataProxy receives a message, it will first be sent to Memory Channel for compression. And use the local Producer to send data to the back-end Cache layer (ie message queue). When the message queue fails to send abnormally, DataProxy will cache the message to the Disk Channel, the local disk. The overall architecture of InLong DataProxy is based on Apache Flume, which extends the source layer and sinks layer. It optimizes disaster recovery forwarding to improve the stability of the system.
Architecture
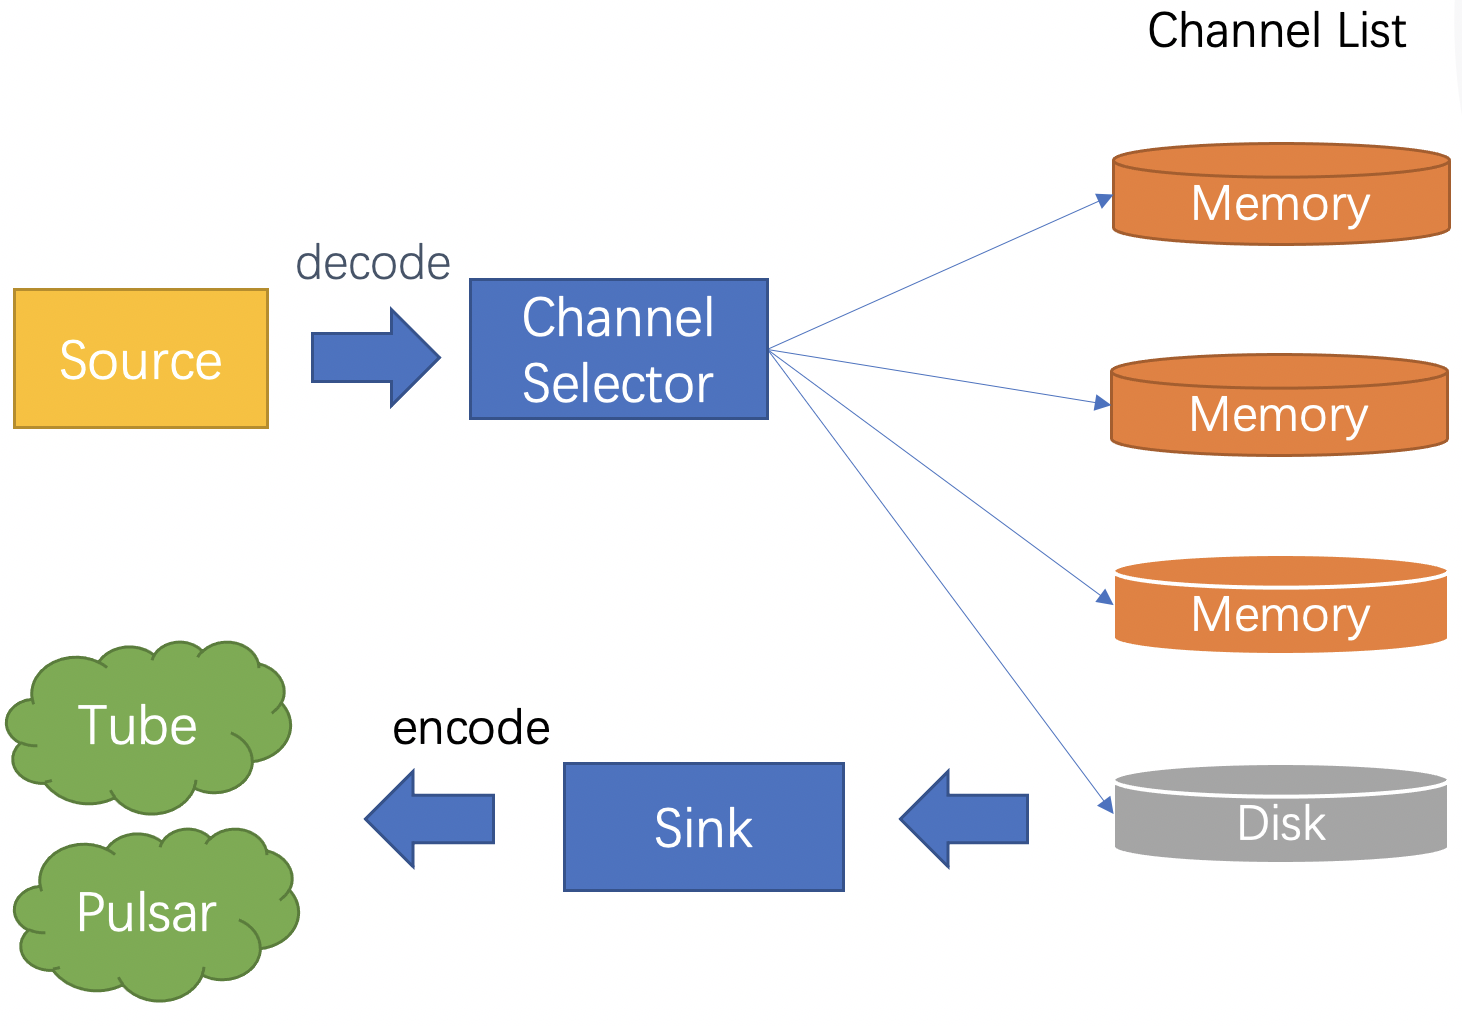
- The source layer opens port monitoring, which is realized through netty server. The decoded data is sent to the channel layer
- The channel layer has a selector, which is used to choose which type of channel to go. If the memory is eventually full, the data will be processed.
- The data of the channel layer will be forwarded through the sink layer. The main purpose here is to convert the data to the TDMsg1 format and push it to the cache layer (tube is more commonly used here)
Monitor Metrics configuration
DataProxy provide monitor indicator based on JMX, user can implement the code that read the metrics and report to user-defined monitor system. Source-module and Sink-module can add monitor metric class that is the subclass of org.apache.inlong.commons.config.metrics.MetricItemSet, and register it to MBeanServer. User-defined plugin can get module metric with JMX, and report metric data to different monitor system.
User can describe the configuration in the file "common.properties ". For example:
metricDomains=DataProxy
metricDomains.DataProxy.domainListeners=org.apache.inlong.dataproxy.metrics.prometheus.PrometheusMetricListener
metricDomains.DataProxy.snapshotInterval=60000
- The JMX domain name of DataProxy is "DataProxy".
- It is defined by the parameter "metricDomains".
- The listeners of JMX domain is defined by the parameter "metricDomains.$domainName.domainListeners".
- The class names of the listeners is separated by the space char.
- The listener class need to implement the interface "org.apache.inlong.dataproxy.metrics.MetricListener".
- The snapshot interval of the listeners is defined by the parameter "metricDomains.$domainName.snapshotInterval", the parameter unit is "millisecond".
The method proto of org.apache.inlong.dataproxy.metrics.MetricListener is:
public void snapshot(String domain, List itemValues);
The field of MetricItemValue.dimensions has these dimensions(The fields of DataProxyMetricItem defined by the Annotation "@Dimension"):
| property | description |
|---|---|
| clusterId | DataProxy cluster ID. |
| sourceId | DataProxy source component name. |
| sourceDataId | DataProxy source component data id, when source is a TCP source, it will be port number. |
| inlongGroupId | Inlong data group ID. |
| inlongStreamId | Inlong data stream ID. |
| sinkId | DataProxy sink component name. |
| sinkDataId | DataProxy sink component data id, when sink is a pulsar sink, it will be topic name. |
The field of MetricItemValue.metrics has these metrics(The fields of DataProxyMetricItem defined by the Annotation "@CountMetric"):
| property | description |
|---|---|
| readSuccessCount | Successful event count reading from source component. |
| readSuccessSize | Successful event body size reading from source component. |
| readFailCount | Failure event count reading from source component. |
| readFailSize | Failure event body size reading from source component. |
| sendCount | Event count sending to sink destination. |
| sendSize | Event body size sending to sink destination. |
| sendSuccessCount | Successful event count sending to sink destination. |
| sendSuccessSize | Successful event body size sending to sink destination. |
| sendFailCount | Failure event count sending to sink destination. |
| sendFailSize | Failure event body size sending to sink destination. |
| sinkDuration | The unit is millisecond, the duration is between current timepoint and the timepoint in sending to sink destination. |
| nodeDuration | The unit is millisecond, the duration is between current timepoint and the timepoint in getting event from source. |
| wholeDuration | The unit is millisecond, the duration is between current timepoint and the timepoint in generating event. |
Monitor indicators have registered to MBeanServer, user can append JMX parameters when running DataProxy, remote server can get monitor metrics with RMI.
-Dcom.sun.management.jmxremote
-Djava.rmi.server.hostname=127.0.0.1
-Dcom.sun.management.jmxremote.port=9999
-Dcom.sun.management.jmxremote.authenticate=false
-Dcom.sun.management.jmxremote.ssl=false