OpenTelemetry Log Report
Overview
As InLong Sort runs on different Task Manager nodes of Apache Flink, each node stores the logs independently, and it is inefficient to view the logs on each node. To solve this, a centralized log management solution based on OpenTelemetry is provided, which allows users to efficiently manage Flink logs.
InLong Sort can integrate the log reporting function into every Connector. The log processing flow is shown in the figure below. The logs are reported through OpenTelemetry, collected and processed by OpenTelemetry Collector, and then sent to Grafana Loki for centralized management.

Integrating Log Reporting for Connector
InLong Sort wraps the OpenTelemetryLogger class, which provides a Builder to help users to quickly configure an OpenTelemetryLogger and can enable or disable logging reporting by calling its install or uninstall functions. With the help of OpenTelemetryLogger, the connector can report logs more easily. The following steps describe how to use the OpenTelemetryLogger class to integrate log reporting for connector based onFLIP-27 standard:
- Construct an
OpenTelemetryLoggerobject usingOpenTelemetryLogger.Builder()in the constructor method of connectorSourceReader's class. - Call
install()method of theOpenTelemetryLoggerobject inStart()function ofSourceReader. - Call
uninstall()method of theOpenTelemetryLoggerobject inclose()function ofSourceReader.
Note: If the maven-shade-plugin plugin is used, the opentelemetry and okhttp related packages need to be included:
<build>
    <plugins>
        <plugin>
            <groupId>org.apache.maven.plugins</groupId>
            <artifactId>maven-shade-plugin</artifactId>
            <version>${plugin.shade.version}</version>
            <executions>
                <execution>
                    <id>shade-flink</id>
                    <goals>
                        <goal>shade</goal>
                    </goals>
                    <phase>package</phase>
                    <configuration>
                        <createDependencyReducedPom>false</createDependencyReducedPom>
                        <artifactSet>
                            <includes>
                                <include>io.opentelemetry*</include>
                                <include>com.squareup.*</include>
                            </includes>
                        </artifactSet>
                    </configuration>
                </execution>
            </executions>
        </plugin>
    </plugins>
</build>
The example is:
import org.apache.inlong.sort.base.util.OpenTelemetryLogger;

public class XXXSourceReader<T>
{

    private static final Logger LOG = LoggerFactory.getLogger(XXXSourceReader.class);

    private final OpenTelemetryLogger openTelemetryLogger;

    public XXXSourceReader() {
        ...
        // initial OpenTelemetryLogger
        this.openTelemetryLogger = new OpenTelemetryLogger.Builder()
                .setServiceName(this.getClass().getSimpleName())
                .setLocalHostIp(this.context.getLocalHostName()).build();
    }

    @Override
    public void start() {
        openTelemetryLogger.install(); //  start log reporting
        ...
    }

    @Override
    public void close() throws Exception {
        super.close();
        openTelemetryLogger.uninstall(); // close log reporting
    }

    ...
}
The OpenTelemetryLogger currently provides the following configuration items:
| Configuration | Description | Default value |
|---|---|---|
endpoint | OpenTelemetry Collector address, if not specified,it will try to get from OTEL_EXPORTER_ENDPOINT environment variable; if the environment variable is not configured, then use the default value. | localhost:4317 |
serviceName | OpenTelemetry's service name, which can be used to distinguish between different connectors. | unnamed_service |
layout | Log4j2's log format, which is an instance of PatternLayout class | %d{HH:mm:ss.SSS} [%t] %-5level %logger{36} - %msg%n |
logLevel | Log level | Level.INFO |
localHostIp | IP of the Flink node, available in SourceReader via this.context.getLocalHostName(). | null |
Docker Configuration
In addition to integrating the log reporting function for Connector, you also need to add three docker containers(opentelemetry-collector, grafana loki, grafana), and configure the OTEL_EXPORTER_ENDPOINT environment variable for the Flink container.
This part of the configuration is already provided in
-inlong-docker-docker-compose-docker-compose.yml. Just add the--profile sort-reportoption when startingdocker composeto enable it. The full command isdocker compose --profile sort-report up -d
You can also refer to the following content to configure your own application, the docker-compose.yml file is shown below:
# flink jobmanager
jobmanager:
  image: apache/flink:1.15-scala_2.12
  container_name: jobmanager
  environment:
    - |
      FLINK_PROPERTIES=
      jobmanager.rpc.address: jobmanager
    - OTEL_EXPORTER_ENDPOINT=logcollector:4317
  ports:
    - "8081:8081"
  command: jobmanager

# flink taskmanager
taskmanager:
  image: apache/flink:1.15-scala_2.12
  container_name: taskmanager
  environment:
    - |
      FLINK_PROPERTIES=
      jobmanager.rpc.address: jobmanager
      taskmanager.numberOfTaskSlots: 2
    - OTEL_EXPORTER_ENDPOINT=logcollector:4317
  command: taskmanager

# opentelemetry collector
logcollector:
  image: otel/opentelemetry-collector-contrib:0.110.0
  container_name: logcollector
  volumes:
    - ./log-system/otel-config.yaml:/otel-config.yaml
  command: [ "--config=/otel-config.yaml"]
  ports:
    - "4317:4317"

# grafana loki
loki:
  image: grafana/loki:3.0.0
  ports:
    - "3100:3100"
  volumes:
    - ./log-system/loki.yaml:/etc/loki/local-config.yaml
  command: -config.file=/etc/loki/local-config.yaml

# grafana
grafana:
  environment:
    - GF_PATHS_PROVISIONING=/etc/grafana/provisioning
    - GF_AUTH_ANONYMOUS_ENABLED=true
    - GF_AUTH_ANONYMOUS_ORG_ROLE=Admin
  entrypoint:
    - sh
    - -euc
    - |
      mkdir -p /etc/grafana/provisioning/datasources
      cat <<EOF > /etc/grafana/provisioning/datasources/ds.yaml
      apiVersion: 1
      datasources:
      - name: Loki
        type: loki
        access: proxy
        orgId: 1
        url: http://loki:3100
        basicAuth: false
        isDefault: true
        version: 1
        editable: false
      EOF
      /run.sh
  image: grafana/grafana:latest
  ports:
    - "3000:3000"
You also need to provide configuration files (otel-config.yaml for logcollector and loki.yaml for Loki). The content of the otel-config.yaml file is:
receivers:
  otlp:
    protocols:
      grpc:
        endpoint: logcollector:4317
processors:
  batch:

exporters:
  logging:
    verbosity: detailed
  otlphttp:
    endpoint: http://loki:3100/otlp
    tls:
      insecure: true

service:
  pipelines:
    logs:
      receivers: [otlp]
      processors: [batch]
      exporters: [otlphttp, logging]
And the content of the loki.yaml file is:
auth_enabled: false

limits_config:
  allow_structured_metadata: true
  volume_enabled: true
  otlp_config:
    resource_attributes:
      attributes_config:
        - action: index_label
          attributes:
            - level
server:
  http_listen_port: 3100

common:
  ring:
    instance_addr: 0.0.0.0
    kvstore:
      store: inmemory
  replication_factor: 1
  path_prefix: /tmp/loki

schema_config:
  configs:
    - from: 2020-05-15
      store: tsdb
      object_store: filesystem
      schema: v13
      index:
        prefix: index_
        period: 24h

storage_config:
  tsdb_shipper:
    active_index_directory: /tmp/loki/index
    cache_location: /tmp/loki/index_cache
  filesystem:
    directory: /tmp/loki/chunks

pattern_ingester:
  enabled: true
Usage
Execute docker compose --profile sort-report up -d in the inlong/docker/ path to start the relevant containers, then create and start a task process according to Data Ingestion (the involved connectors need to be integrated with OpenTelemetryAppender).
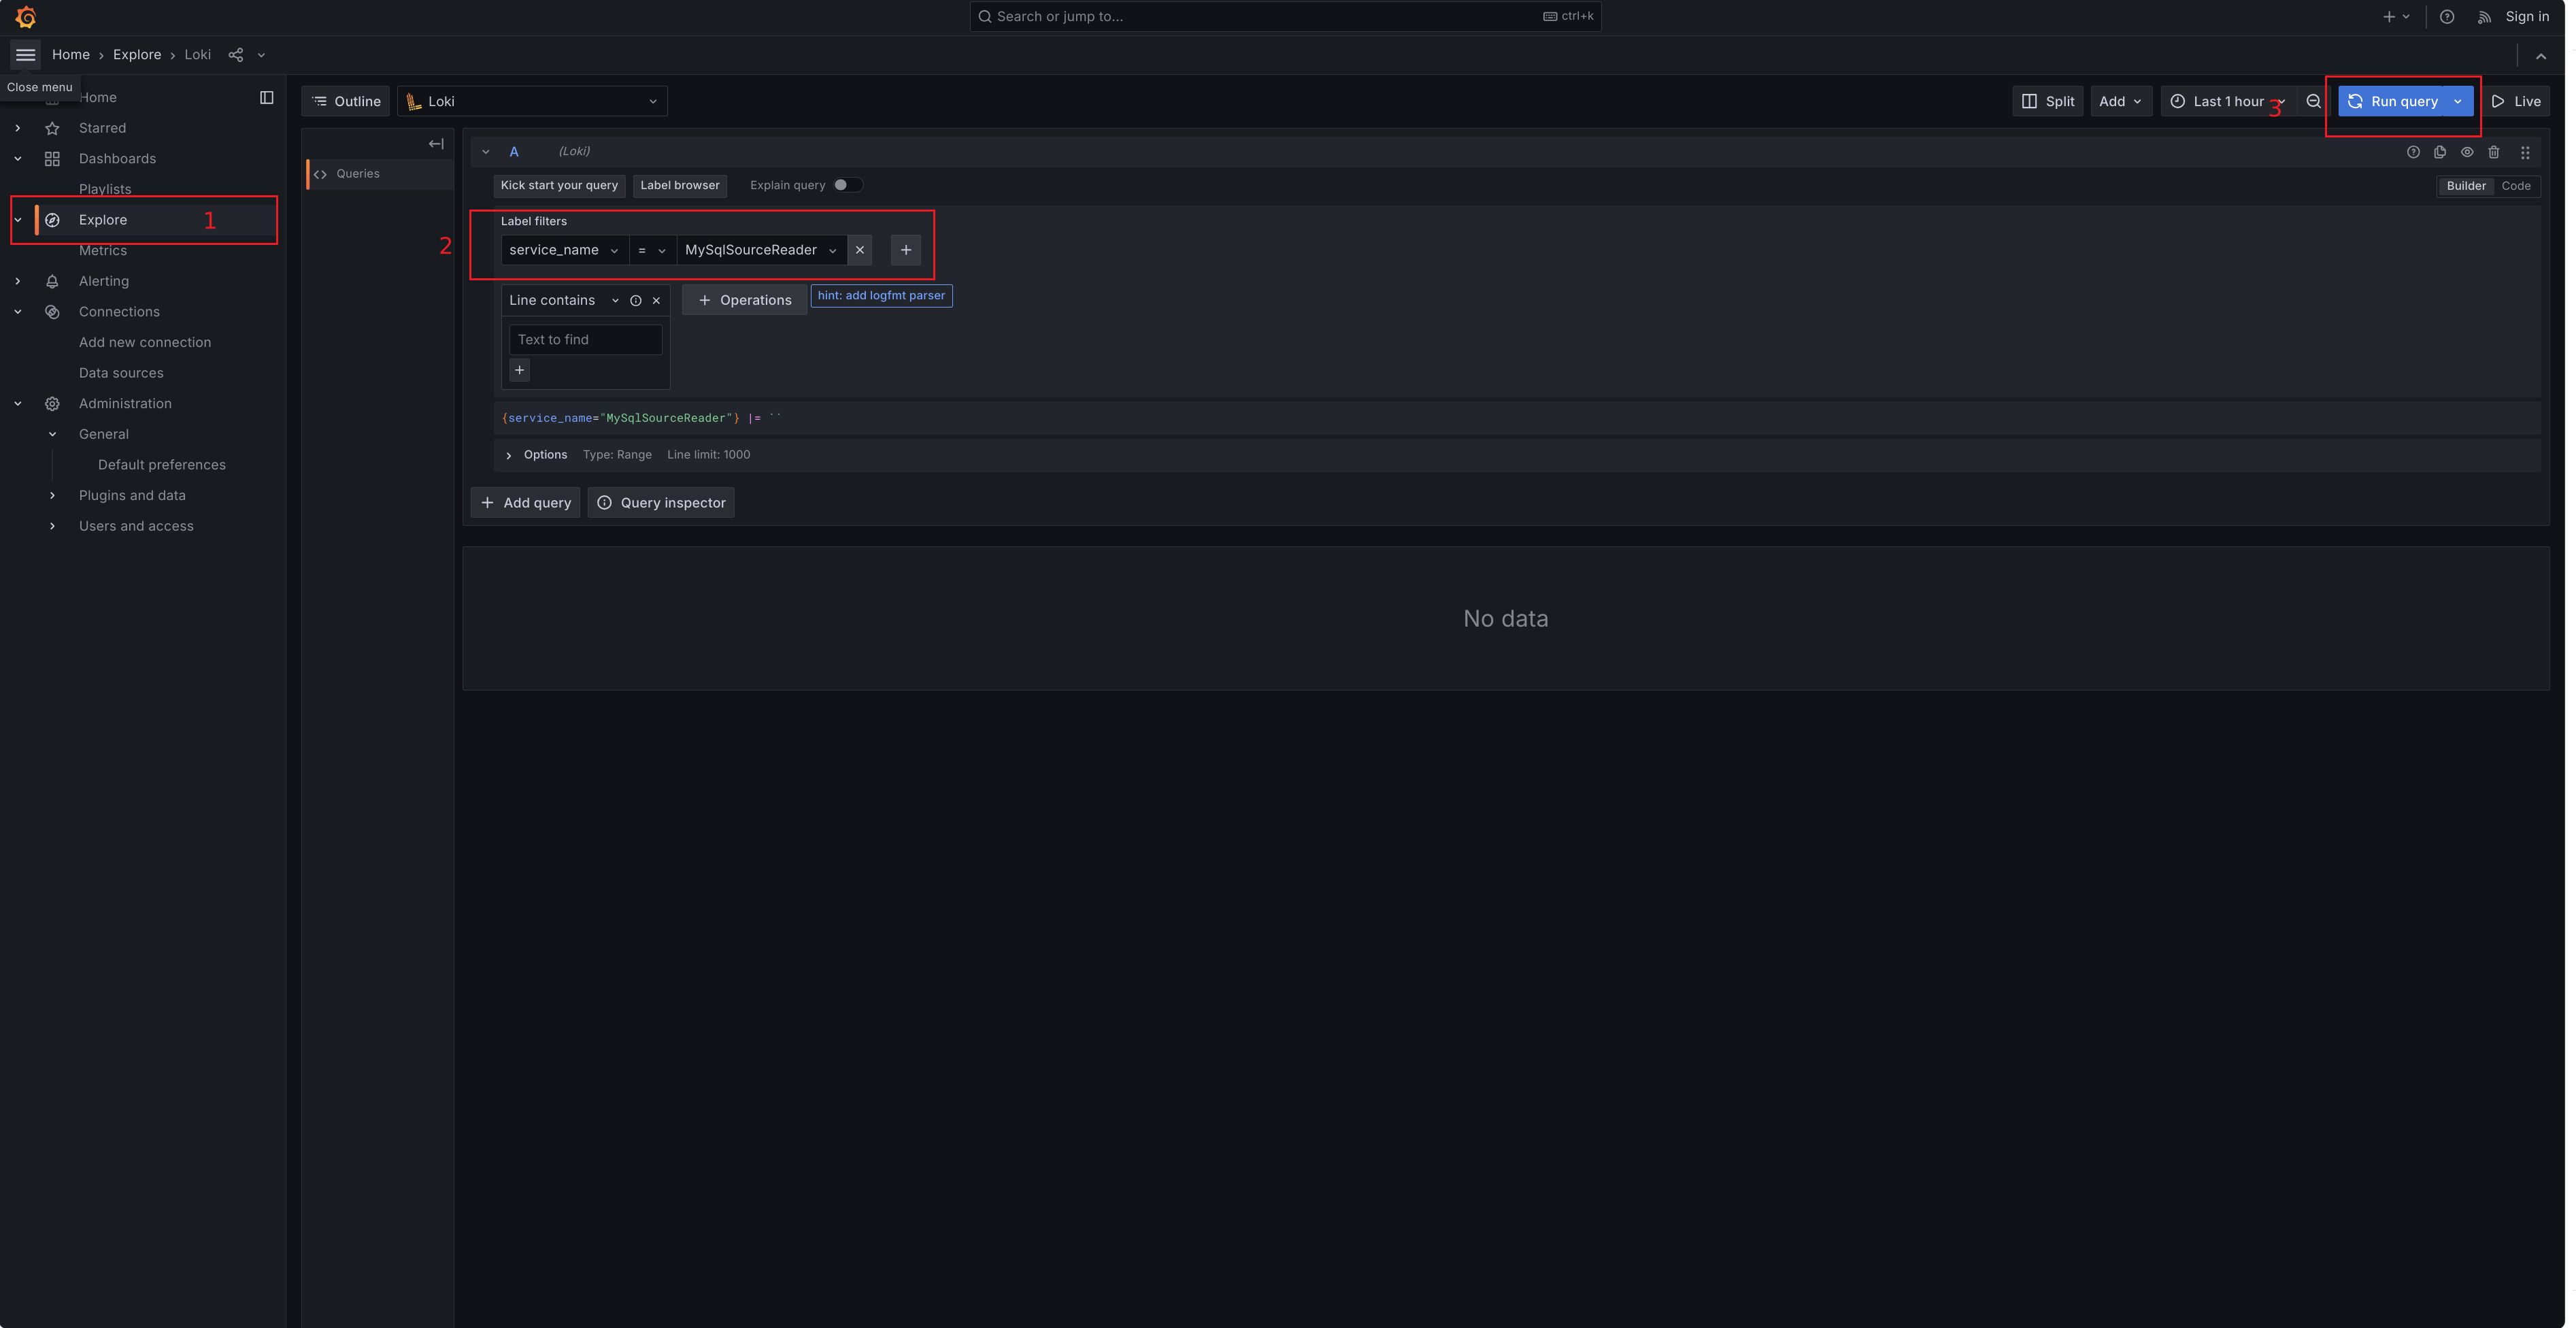
After that you can enter the Grafana Loki system by http://127.0.0.1:3000/explore, and query the logs by the service_name field:

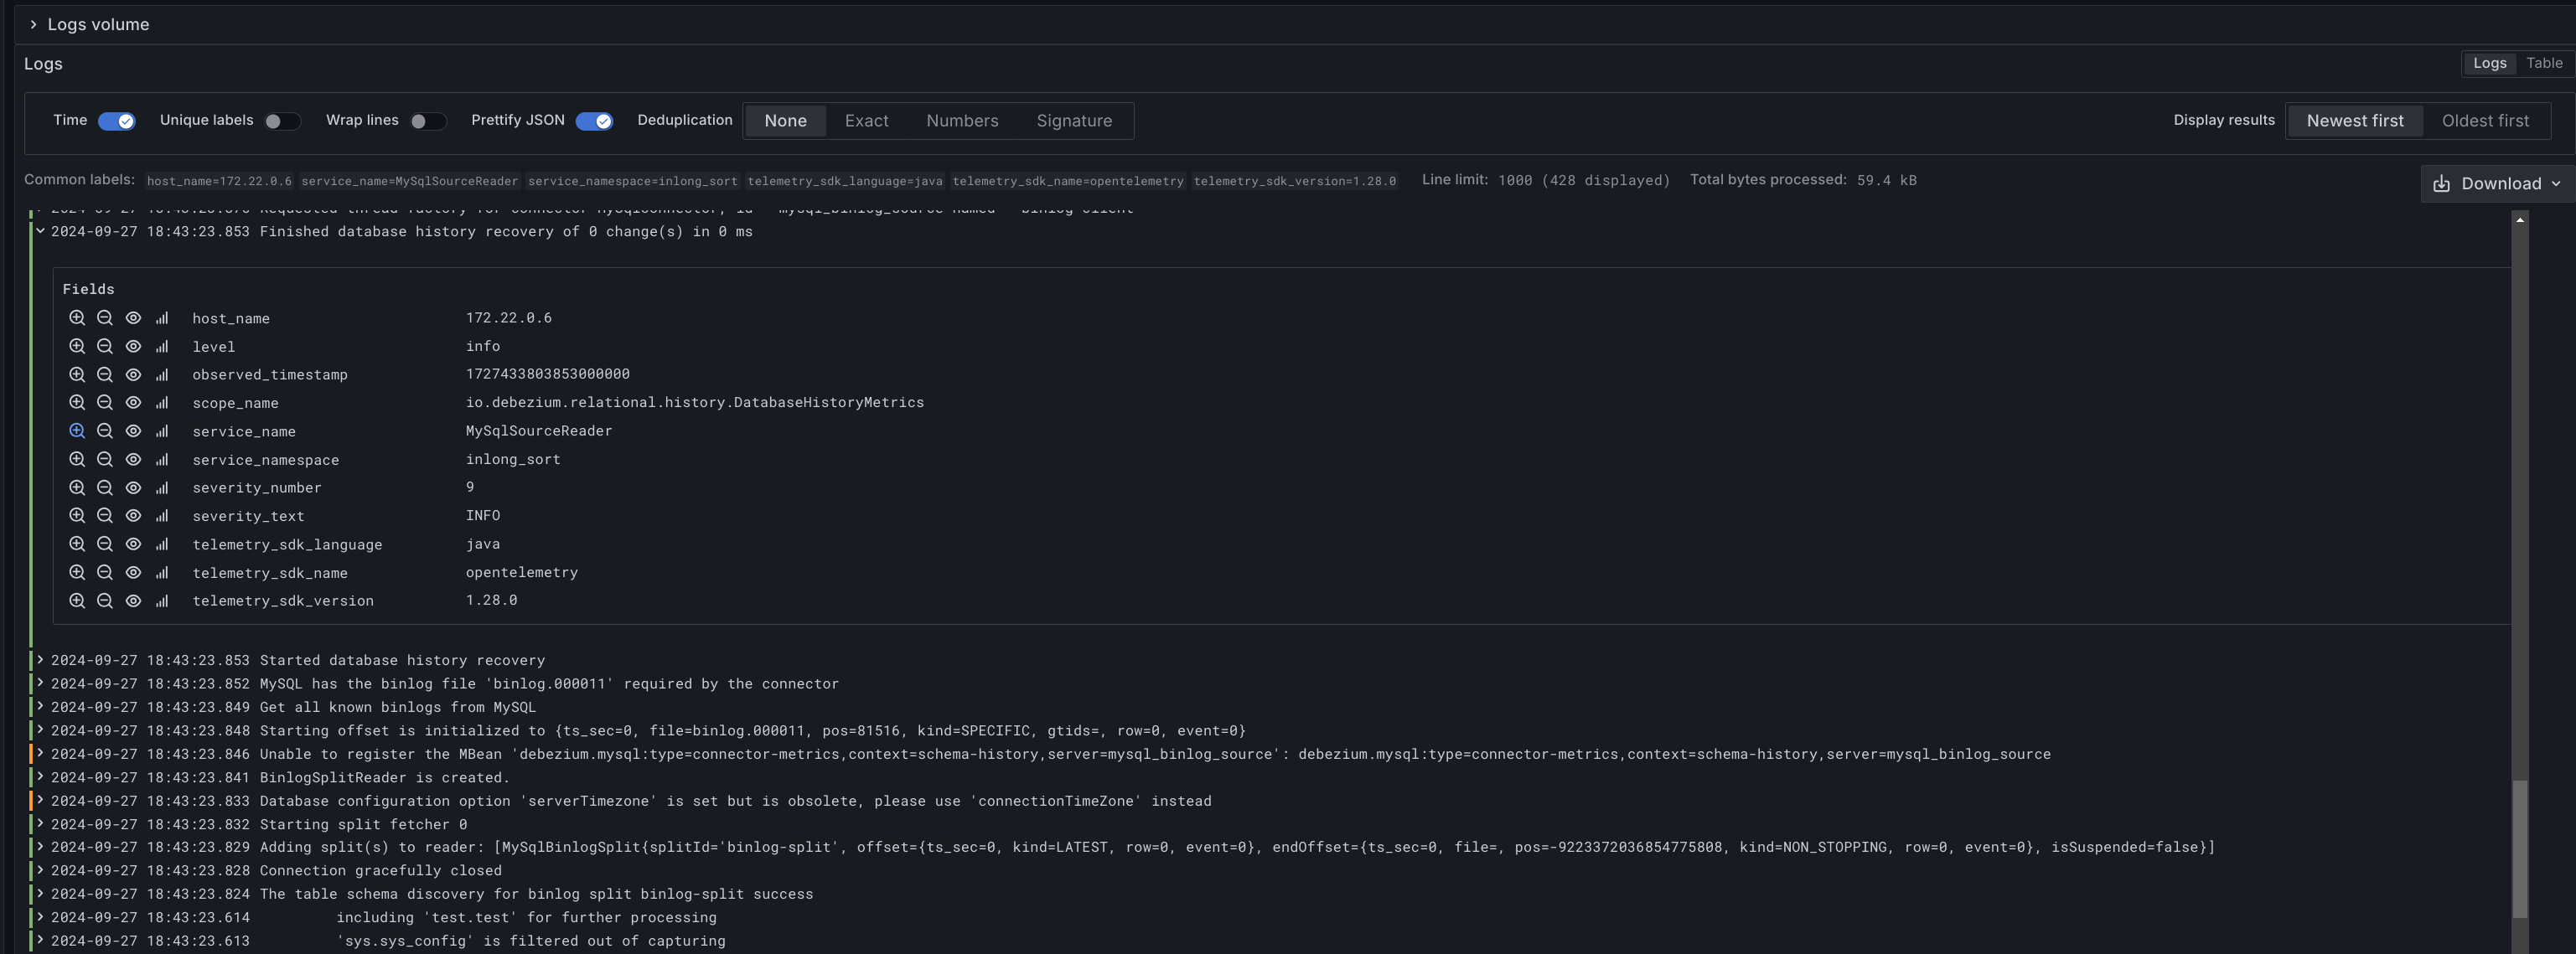
Click on the log item to view the log details (Note: The default log reporting level is ERROR.):
